Two hours at 2fps is around 14,000 frames. Most of them are noise: the cursor blinks, the system clock ticks, nothing in the code moved. The first step isn't clever. It's just getting rid of those.
Five passes, five different cuts
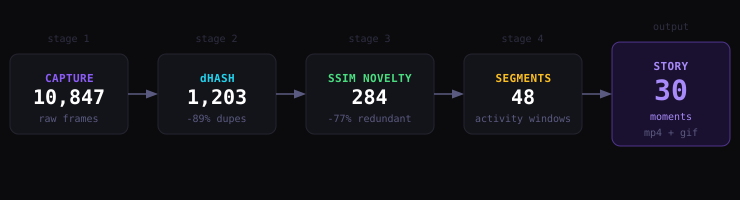
Each stage kills a different category of useless frame. Real numbers from a 2-hour session:
Stage 1 — dHash: kill the identical frames
89% gone in one pass. If you record at 2fps and type at a normal pace, maybe one keystroke lands per 3–5 frames. Everything in between is the same screenshot with the cursor in a different blink state.
dHash resizes each frame to 9×8 pixels, converts to greyscale, then compares each pixel to the one on its right (1 if brighter, 0 otherwise). 8 rows × 8 comparisons = 64 bits per frame, stored as a BigInt. XOR two hashes and count the differing bits. Distance ≤ 8: duplicate.
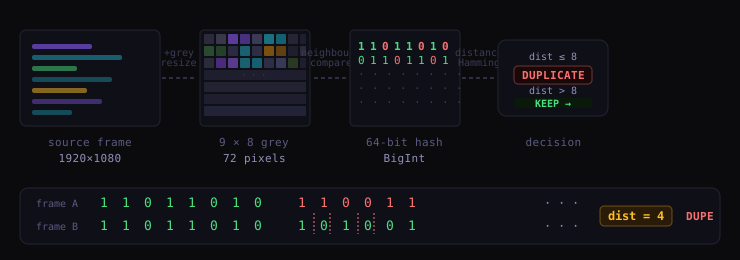
Counting those differing bits naively loops 64 times. Kernighan's trick loops once per set bit, so for near-duplicates that's typically 2–6 iterations, not 64:
export function hammingDistance(a: DHash, b: DHash): number {
  let diff  = a ^ b;      // XOR: 1 where bits differ
  let count = 0;
  while (diff > 0n) {
    diff &= diff - 1n;    // clears the lowest set bit
    count++;
  }
  return count;
}Stage 2 — SSIM: kill the boring frames
Unique isn't the same as interesting. After dHash you still have ~1,200 frames that each look slightly different, but most of that difference is one more character on a line. You need a score that reflects how much the visual state actually changed, not just whether the pixels moved.
SSIM (Structural Similarity Index) compares luminance, contrast, and spatial structure between consecutive frames. Score close to 1: nothing happened. Score close to 0: something worth keeping.
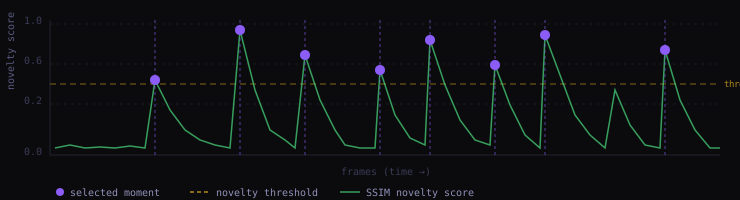
Full-frame SSIM would average out a big change in one corner against stagnation everywhere else. Instead the frame is tiled into 16 regions, SSIM computed per region, then averaged. A file-save that changes the status bar doesn't steal credit from a tab switch that changed everything.
The formula needs mean, variance, and covariance for each region. The naive path does two loops: one for the mean, one for the variance. Both collapse into one using Var(X) = E[X²] − E[X]²: accumulate Σx, Σx², Σy, Σy², Σxy in a single pass and derive everything after:
let sumA=0, sumB=0, sumAA=0, sumBB=0, sumAB=0;
const n = (x1-x0) * (y1-y0);

for (let y=y0; y<y1; y++) {
  for (let x=x0; x<x1; x++) {
    const pa = a.pixels[y*W+x] ?? 0;
    const pb = b.pixels[y*W+x] ?? 0;
    sumA  += pa;    sumB  += pb;
    sumAA += pa*pa; sumBB += pb*pb; sumAB += pa*pb;
  }
}

const muA = sumA/n, muB = sumB/n;
const varA  = sumAA/n - muA*muA;   // Var(X) = E[X²] − E[X]²
const varB  = sumBB/n - muB*muB;
const covAB = sumAB/n - muA*muB;
Stage 3 — Segmentation: budget the moments fairly
Sessions aren't uniformly active. There's 20 minutes of flow where you're actually building something, then 10 minutes reading docs, then another sprint. If you spread the 30-moment budget evenly across the timeline, the reading gaps eat slots that should go to the interesting parts.

The pipeline splits the frame sequence into activity windows by novelty density. Each window's share of the budget scales with how much happened inside it. A 20-minute sprint might take 8 moments; a 10-minute idle stretch gets 1.
What comes out
30 moments → a GIF or MP4, under 30 seconds, no input from you. Each moment holds for a duration proportional to the activity level of its segment: busier parts play faster, idle parts barely appear.

No frames leave the machine. The app calls no model. Run it twice on the same input and you get the same output. That last part matters more than it sounds: a non-deterministic story compressor is harder to trust and impossible to debug.
What's next
Pixel distance is one way to measure novelty, but SSIM can't tell “opened a new file” from “typed one character” because both move roughly the same number of pixels. A CLIP embedding delta would catch that difference. That's the next scorer to try, once there's a feedback loop to check whether it actually picks better moments or just different ones.
The feedback loop needs data first: a drag-to-remove UI so users can mark which moments they'd cut. A few hundred sessions of that and there's something real to validate against.
The rest of the pipeline doesn't change. The novelty scorer sits behind a port in packages/engine: swap it out, everything else stays.
Code
MIT, pnpm monorepo, 187 tests, CI on macos-latest. The algorithm lives in packages/engine/src/ with no Electron dependency, runs in plain Node. If you want to poke at the frame selection logic without building the whole app, that's the entry point.