A research platform should not make it easy to stop at a good-looking number. I built one that forces each hypothesis through three increasingly hostile tests: transaction costs, a sealed holdout year, and a parameter robustness sweep. Here is what went in and what came out.
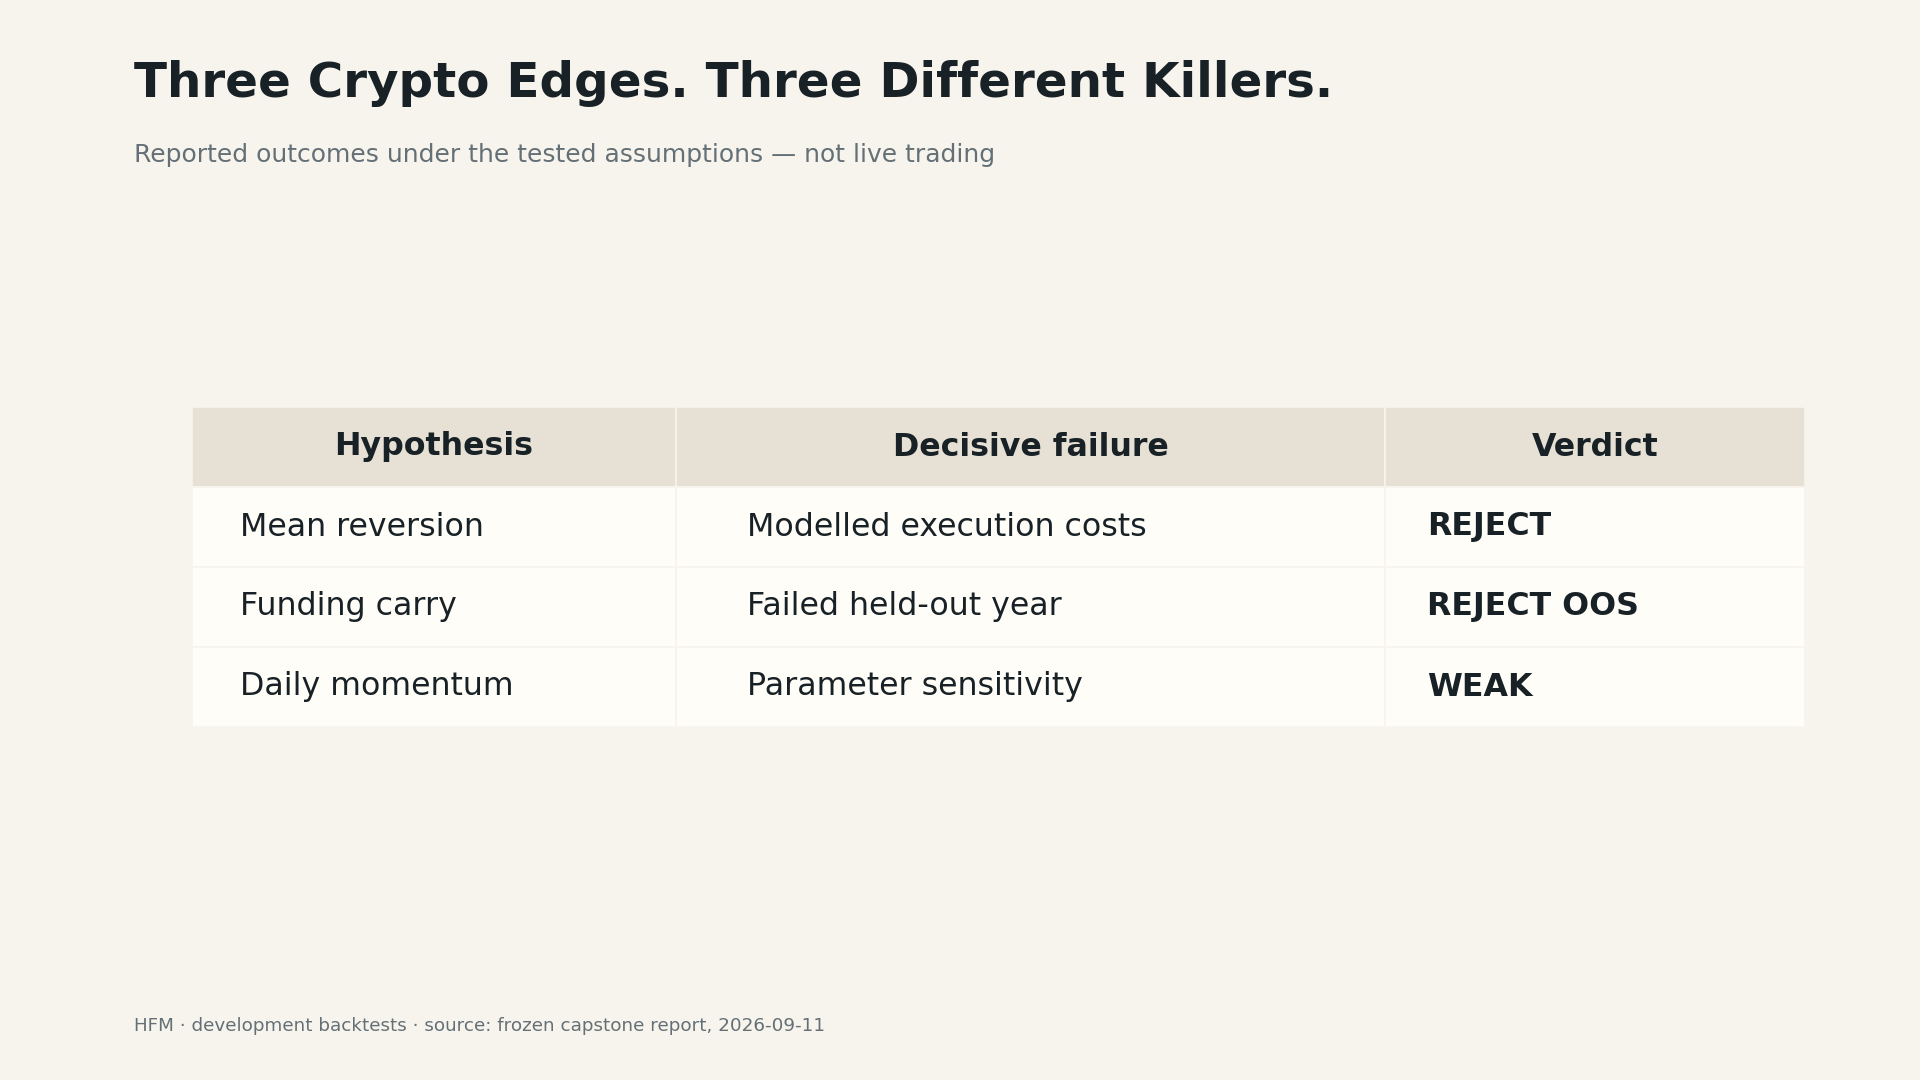
| Edge | Peak result | Killer | Verdict |
|---|---|---|---|
| Price mean reversion | Gross Sharpe 7–13 | Transaction costs | REJECT |
| Funding carry | +48.6% net, Sharpe 1.17 | Sealed holdout year | REJECT out-of-sample |
| Daily momentum | +97% net, best case | Robustness checks | WEAK |
Edge 1: Mean reversion, killed by costs
Cross-sectional reversal on 15-minute crypto bars had a gross Sharpe between 7 and 13, positive in over 80% of out-of-sample windows across 76 test periods. In this development sample, recent relative losers tended to outperform recent relative winners before transaction costs.
None of the tested implementations produced a robust net result after modelled costs. Rebalancing every bar, friction ran 5 to 10 times the size of the available edge. I tested entry and exit thresholds, hysteresis to reduce turnover, slower timeframes, and less frequent rebalancing. Nothing produced a parameter plateau. Adjacent settings swung from +45% to −60% net. Positive settings existed, but they did not establish a stable, tradeable result.
These figures summarize the earlier research revisions in the source report. A separate deep-dive examines a controlled evaluation; its metrics should not be mixed with this summary as if they came from one run.
Edge 2: Funding carry, killed by a sealed holdout
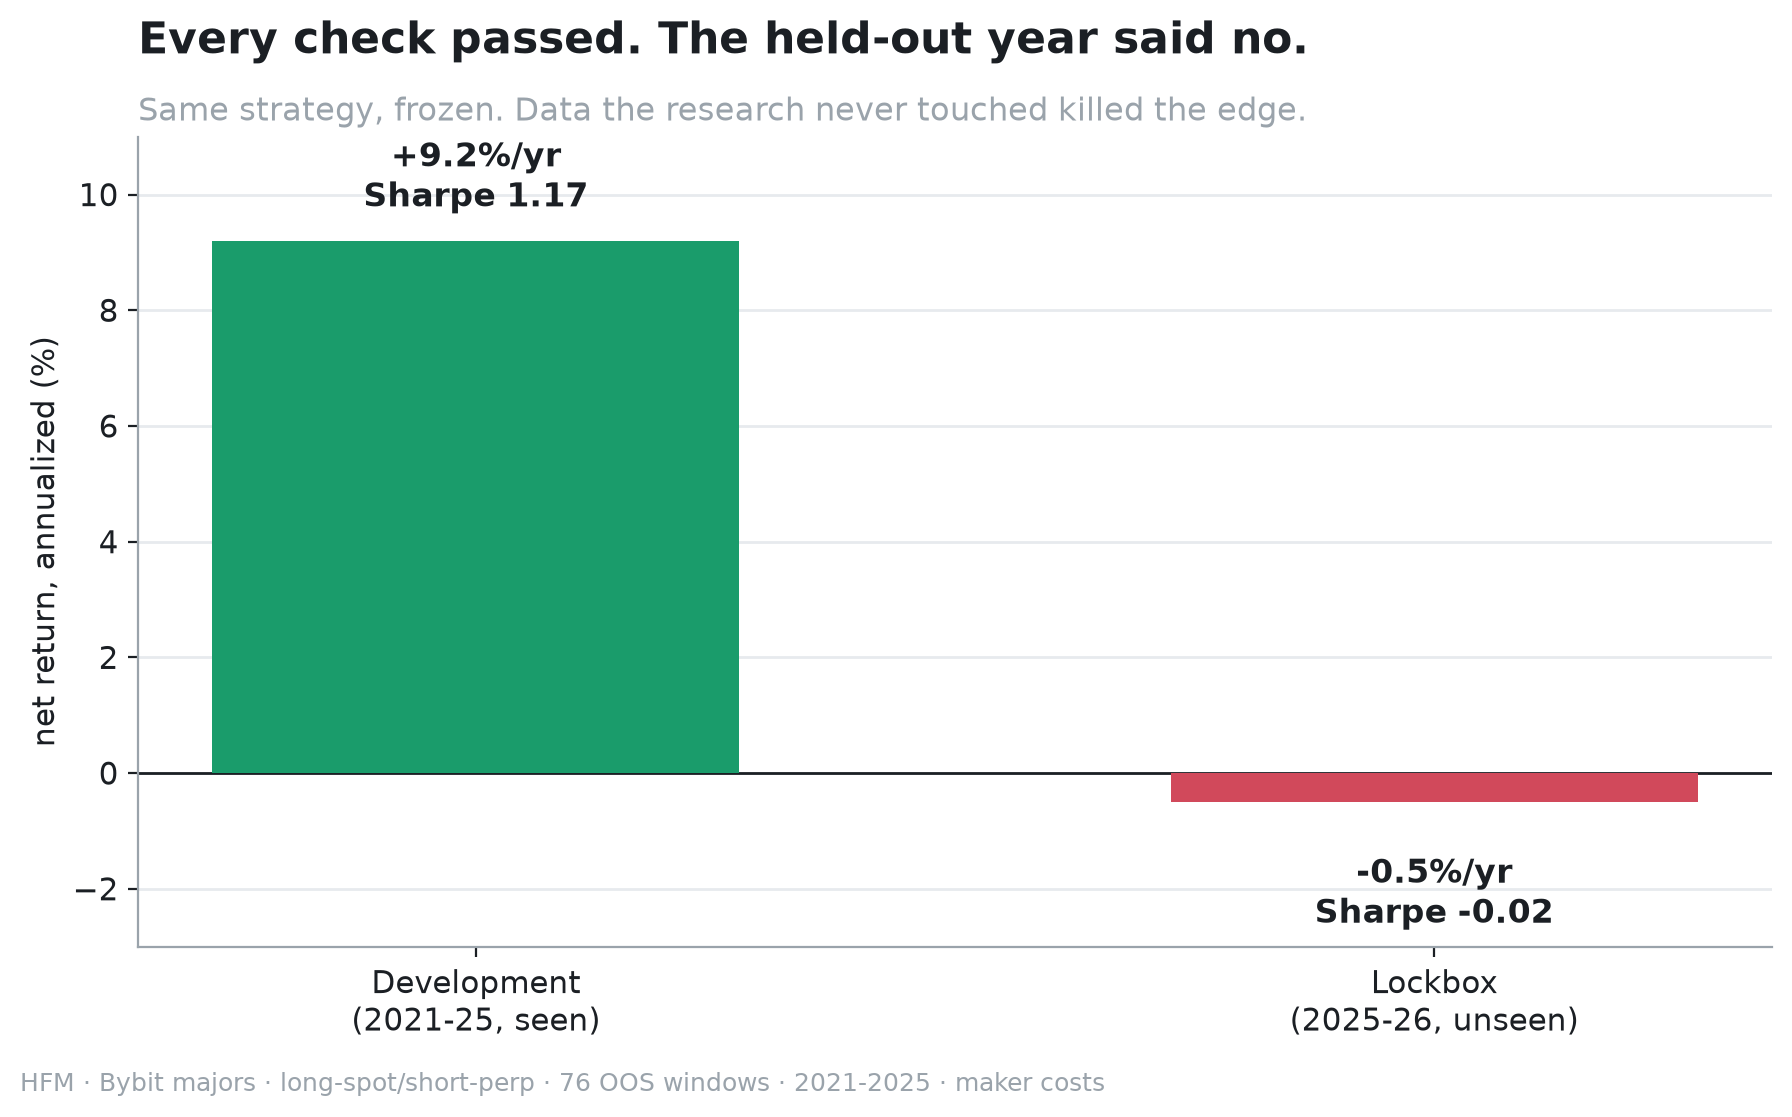
Funding carry is structurally different from price reversion: long spot, short the perpetual, collect the funding rate. Lower turnover reduces the transaction-cost burden; it does not eliminate execution costs or other risks. On development data covering 4.5 years across 76 walk-forward windows, the result was +48.6% net, Sharpe 1.17, positive every single year including the 2022 bear market.
Before treating that as a tradeable result, I ran two tests. A null decomposition shuffled which coin's funding the strategy received. The null still made +28%, suggesting that a substantial part of the development return did not depend on selecting the right coins. This was evidence of a shared funding premium in that sample, not proof of a durable selection edge.
Then I opened the lockbox: the held-out period from September 2025 to September 2026, sealed before the project began and never examined. The frozen strategy ran unchanged on data not used to develop it.
Edge 3: Daily momentum, killed by robustness
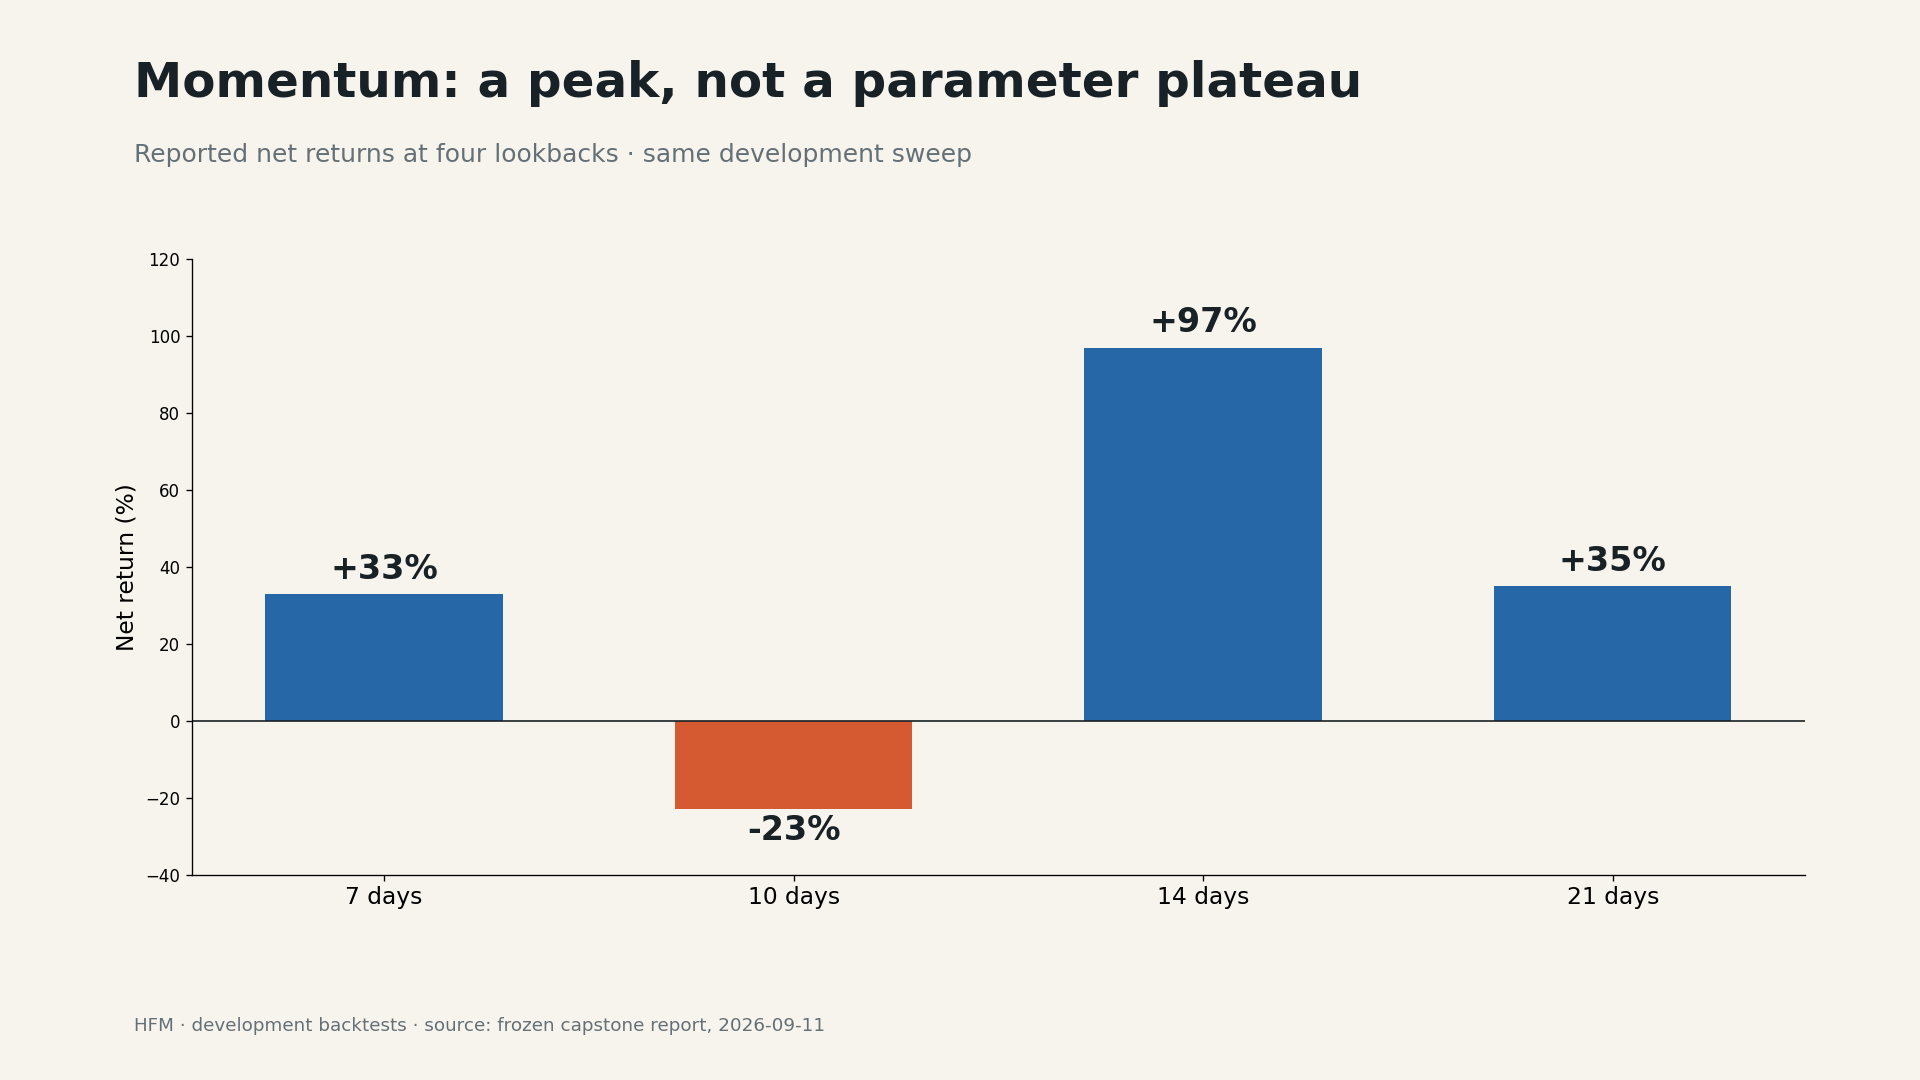
Daily cross-sectional momentum trades a weekly rebalance and survives costs where 15-minute reversion could not. The best configuration produced +97% net even at taker fees. But a single number is not a result.
The lookback sweep was not a plateau. It was a spike: 7 days +33%, 10 days −23%, 14 days +97%, 21 days +35%. The +97% configuration was not locally robust. Without an economic reason to prefer exactly 14 days over 10 or 21, I could not distinguish discovery from parameter selection.
The regime analysis completed the picture: about half the return came from the 2021 bull market, with 2022 negative. That profile is consistent with residual market exposure, but this experiment did not estimate a formal beta decomposition.
Three killers, three different causes
If all three edges had failed the same way, the lesson would be narrow. Mean reversion failed at the execution layer before reaching a holdout. Funding carry looked promising in development but failed to reproduce that performance on genuinely unseen data. Momentum failed on the question of whether the result was robust or merely the best-looking number in a sweep.
Each guard catches a different class of failure. A research process that only runs one of them will pass strategies that the others would have killed. Running all three means knowing specifically why each candidate fails, not just whether one survives.
No strategy. Three precise diagnoses.
No tradeable edge came out of this. What the framework produced was a bounded diagnosis for each hypothesis: one pre-cost pattern failed the tested execution assumptions, one carry result failed its sealed year, and one momentum result failed local robustness checks.
The next hypothesis goes into the same framework, not into a live account.
This article summarizes development backtests, not live trading. The frozen research report and figures document the reported results; the package is not a complete independent reproduction of the private data pipeline.
Evidence source SHA-256: cf9ce73542af24be3e5c2872864b2b41c6ce864e3b2f07b760e5434a1bdb23ba