58 hypotheses went in. 48 were rejected, 9 remained promising, and 1 could not be evaluated because the required data was unavailable.
None of the 9 earned the label “edge.” They earned the right to be tested further.
Some ideas should die before a backtest is ever run. The rest should face the cheapest falsification test first. A hypothesis that cannot answer “who pays us?” and “why does this persist?” is not a hypothesis. It is a guess with a Python file attached.
The kill pipeline that processed all 58, in the order most ideas die:
hypothesis idea
    ↓
cost filter        (does it survive fees and turnover at all?)
    ↓
robustness check   (is the result a plateau or a lucky parameter?)
    ↓
null benchmark     (does it beat a structure-preserving random version?)
    ↓
untouched holdout  (does it hold on a year it never saw?)
    ↓
contamination audit (is the result real or did the code lie to me?)
    ↓
survived research → forward / shadow validation → capital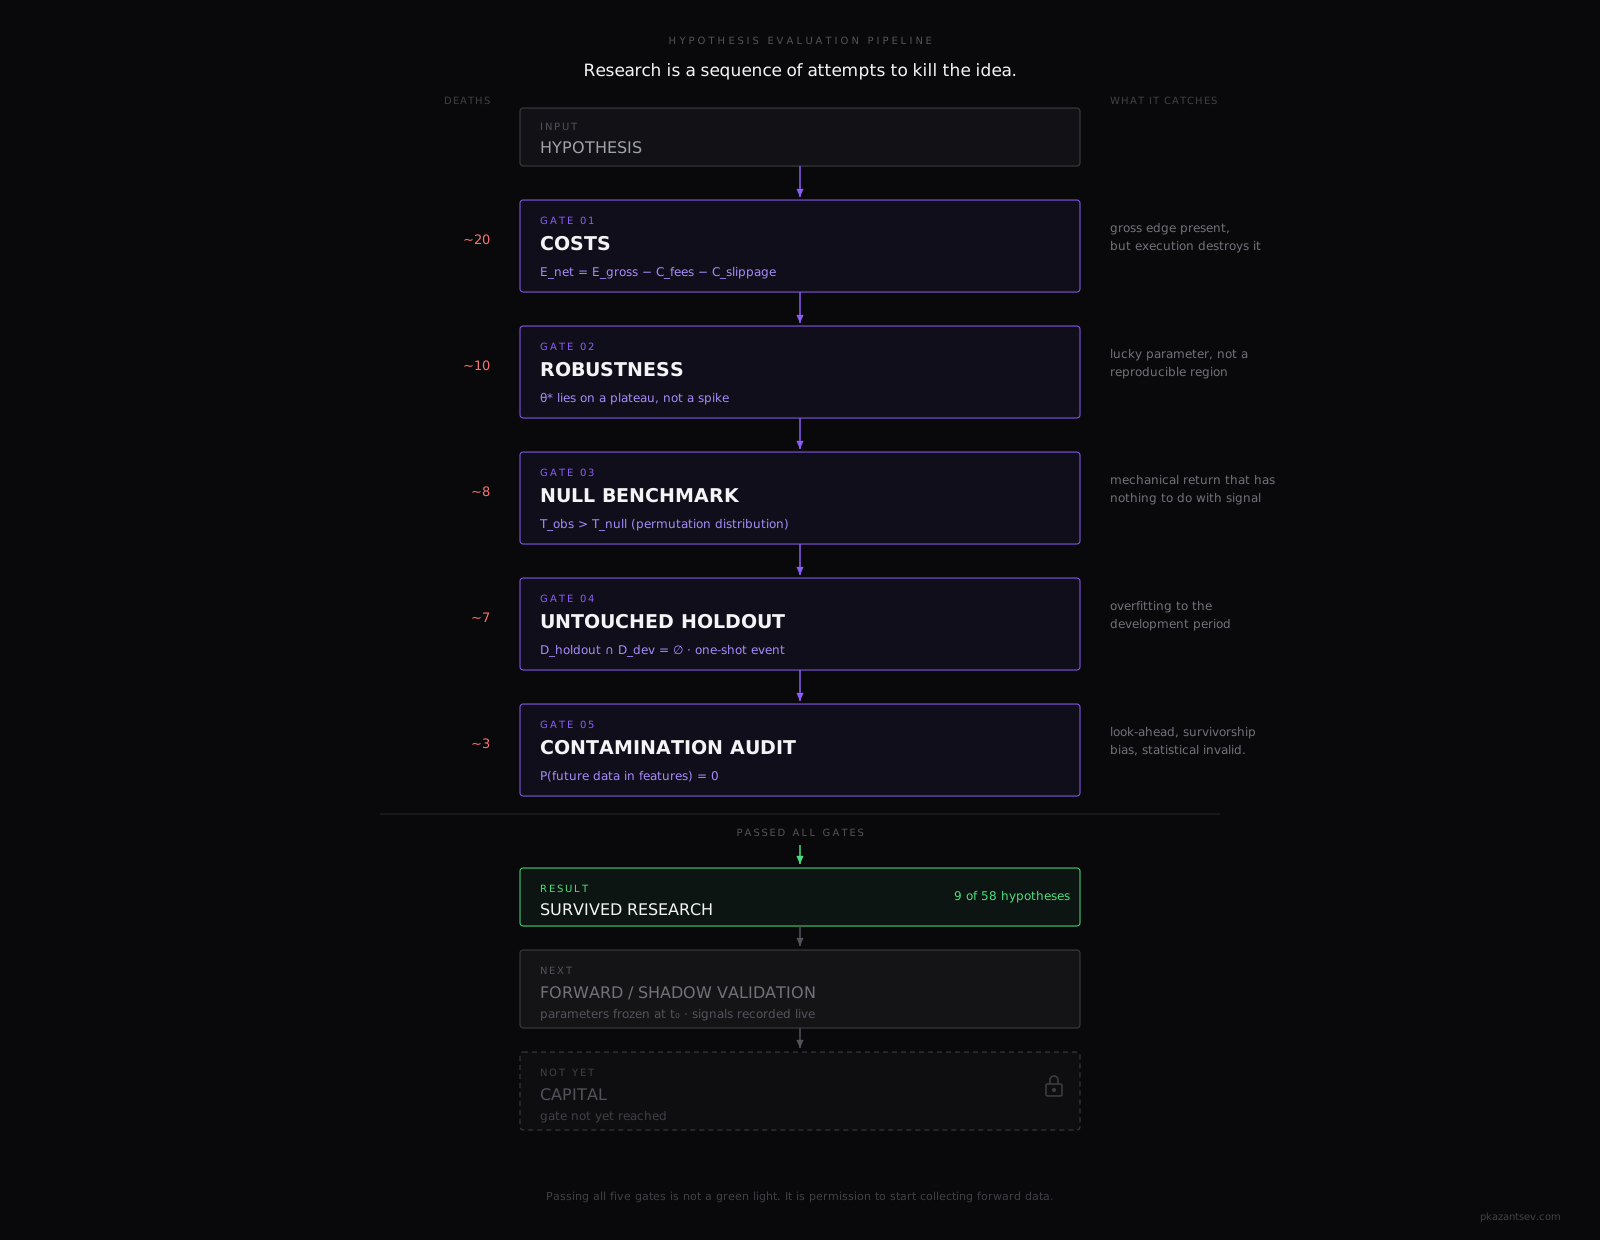
Each gate catches a different type of false alpha. A strategy can clear the first four and die on the fifth. Passing all five is not a green light. It is permission to start collecting forward data.
Gate 1: costs
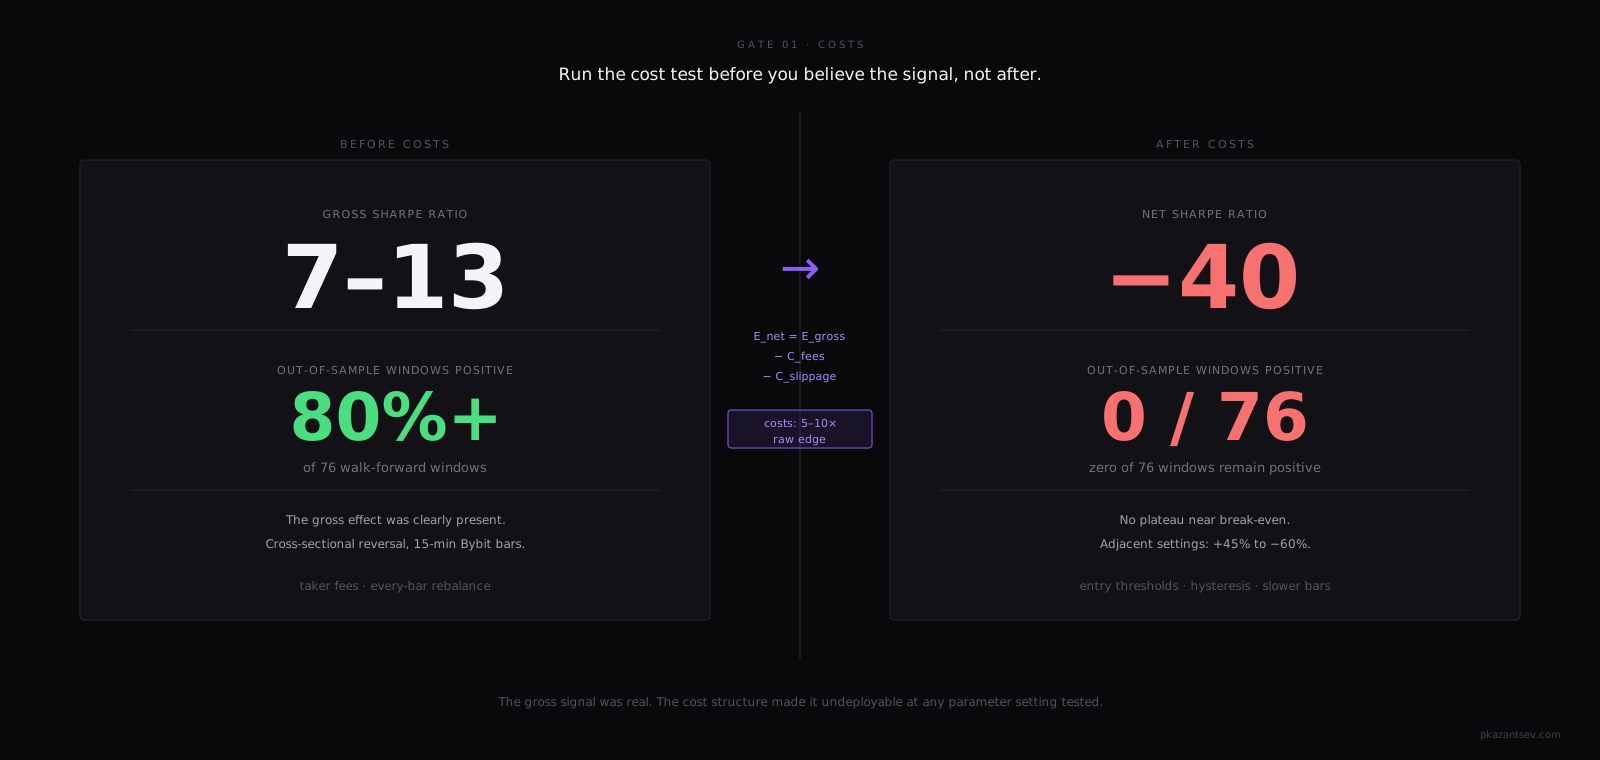
The most common way a backtest looks good: skip costs. Cross-sectional reversal on 15-minute Bybit bars had a gross Sharpe of 7 to 13, positive in 80%+ of out-of-sample windows. The gross effect was clearly present before costs. At taker fees, rebalancing every bar, trading costs ran 5 to 10 times the size of the raw edge. After costs, zero out of 76 out-of-sample windows remained positive.
I tried entry/exit thresholds, hysteresis, coarser timeframes, slower rebalancing. No plateau anywhere near break-even. Adjacent parameter settings swung from +45% to −60%.
Run the cost test before you believe the signal, not after.
Gate 2: robustness
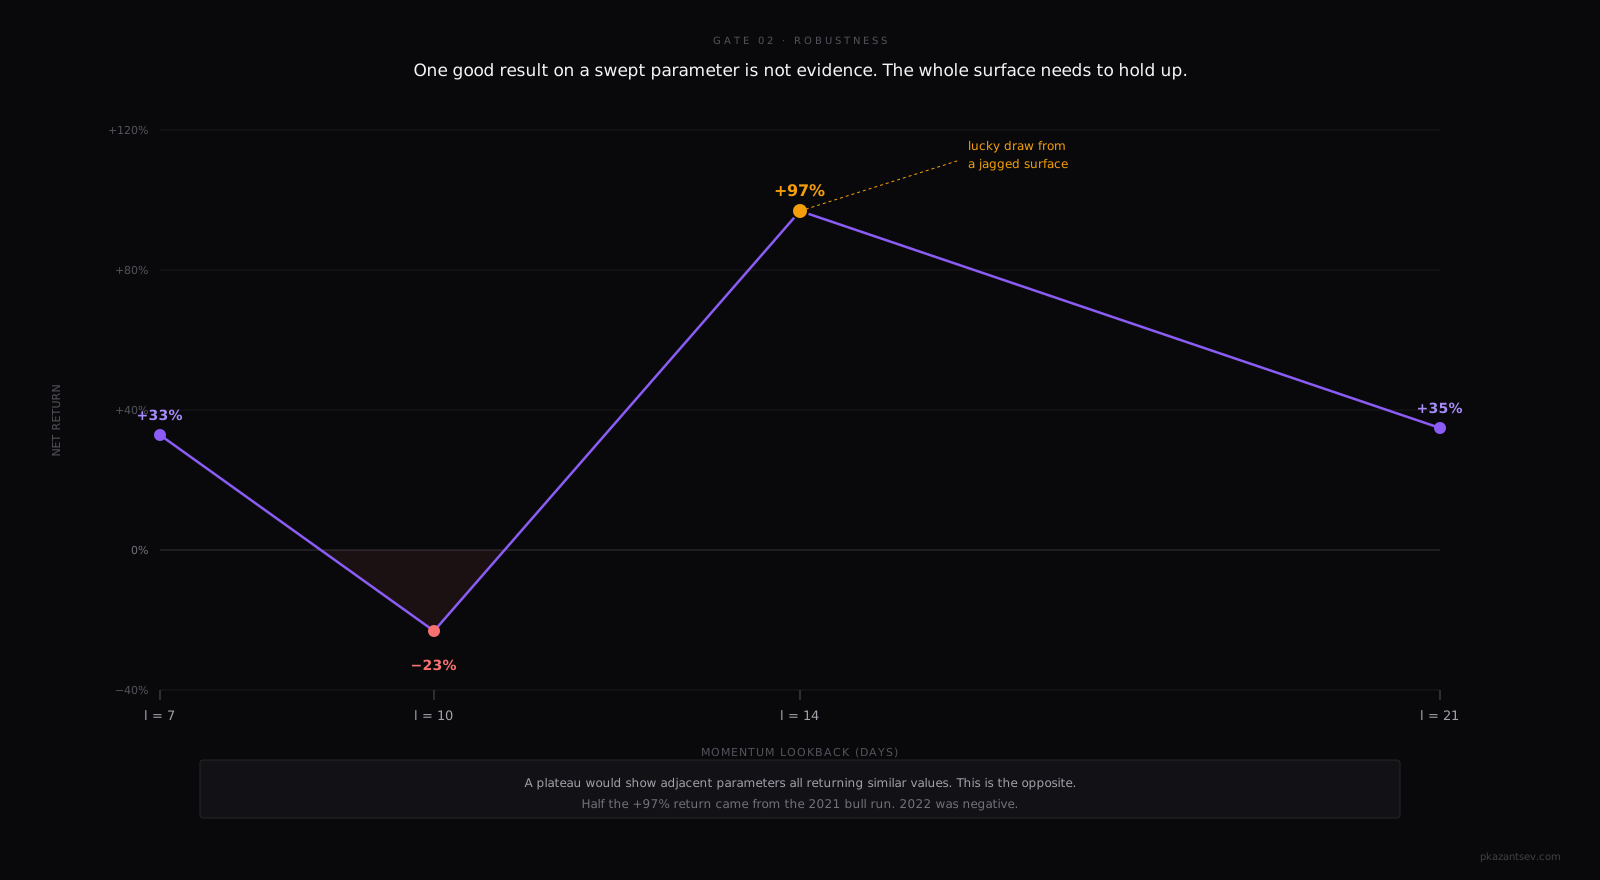
Daily momentum had one configuration that returned +97% net at taker fees. The lookback sweep: l=7 gave +33%, l=10 gave −23%, l=14 gave +97%, l=21 gave +35%. No plateau. The +97% was a lucky draw from a jagged surface.
Half the return came from the 2021 bull alone. 2022 was negative. A strategy that only makes money in bull markets and loses in bear is more consistent with market beta than neutral alpha.
One good result on a swept parameter is not evidence. The whole surface needs to hold up.
Gate 3: null benchmark
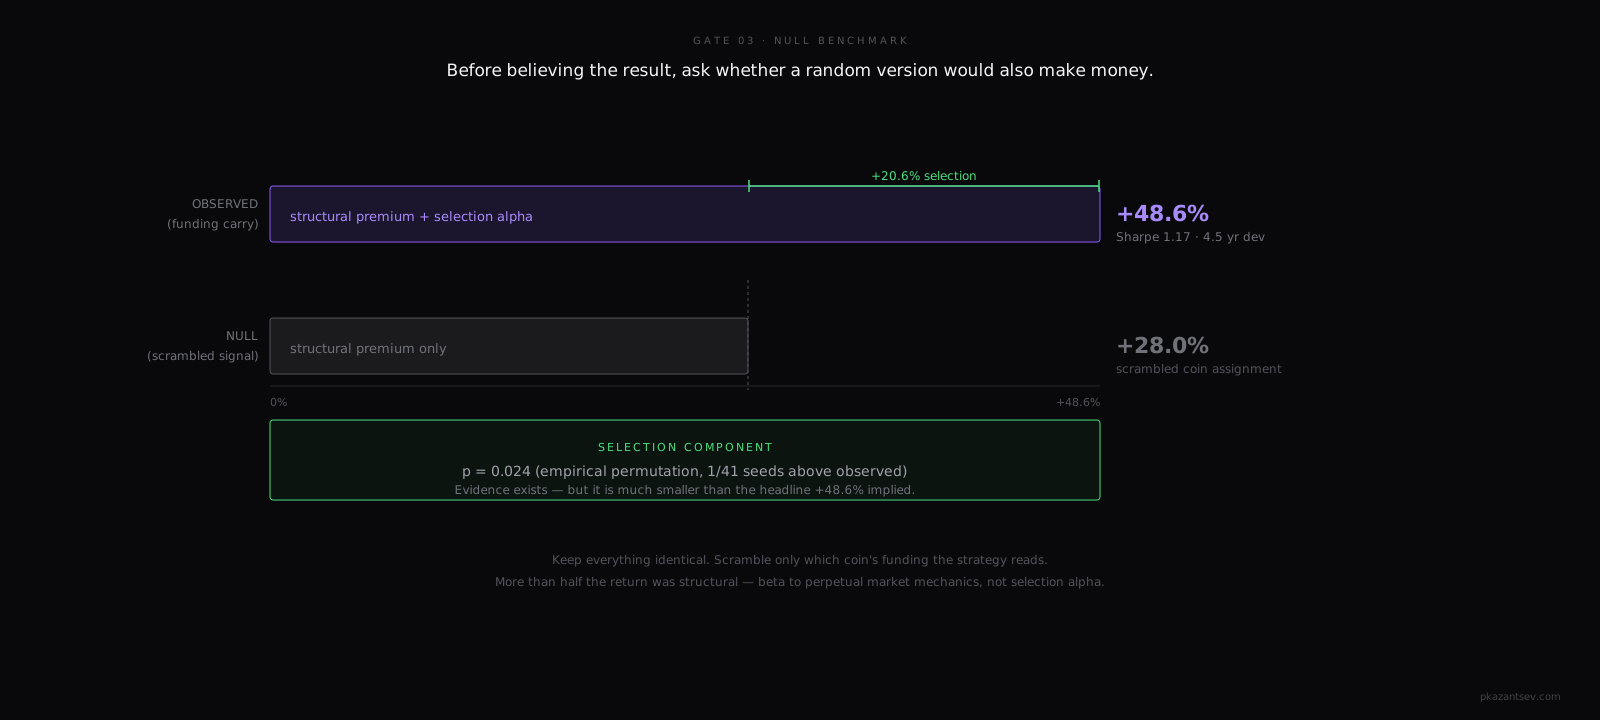
Funding carry looked strong in development: +48.6% net over 4.5 years, Sharpe 1.17. Before trusting it, I ran a null test: scramble which coin's funding the strategy reads, keep everything else identical. The scrambled version returned +28%.
More than half the return was the structural funding premium — exposure to perpetual market mechanics rather than signal-driven selection. The selection component showed evidence beyond this null in development (empirical permutation p=0.024), but it was much smaller than the headline return implied.
Before believing the result, ask whether a random version of the signal would also make money.
Gate 4: untouched holdout
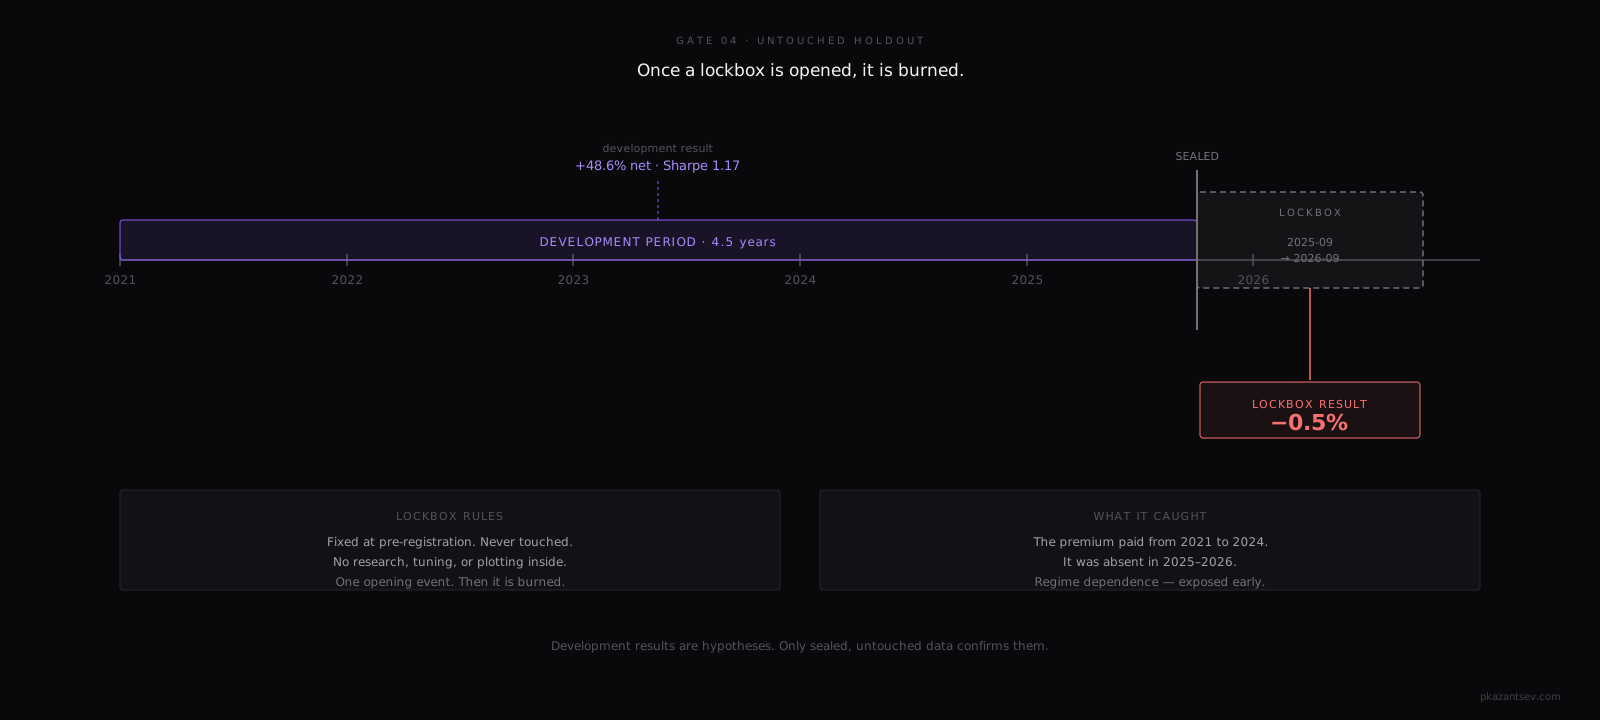
The lockbox is a date range fixed in advance, never touched until a single opening event. No research, no tuning, no plotting inside that range until development is complete.
Funding carry passed development and validation. The lockbox was a 12-month period (2025-09 to 2026-09), sealed from day one. The frozen strategy made −0.5% on it. The premium that paid from 2021 to 2024 was absent in the lockbox year. One year of absence is not a permanent verdict. It is exactly the kind of regime dependence the lockbox is designed to expose early.
Once a lockbox is opened, it is burned. Any further confirmation requires a new, still-unseen date range. Development results are hypotheses, and only sealed, untouched data can confirm them.
Gate 5: contamination audit
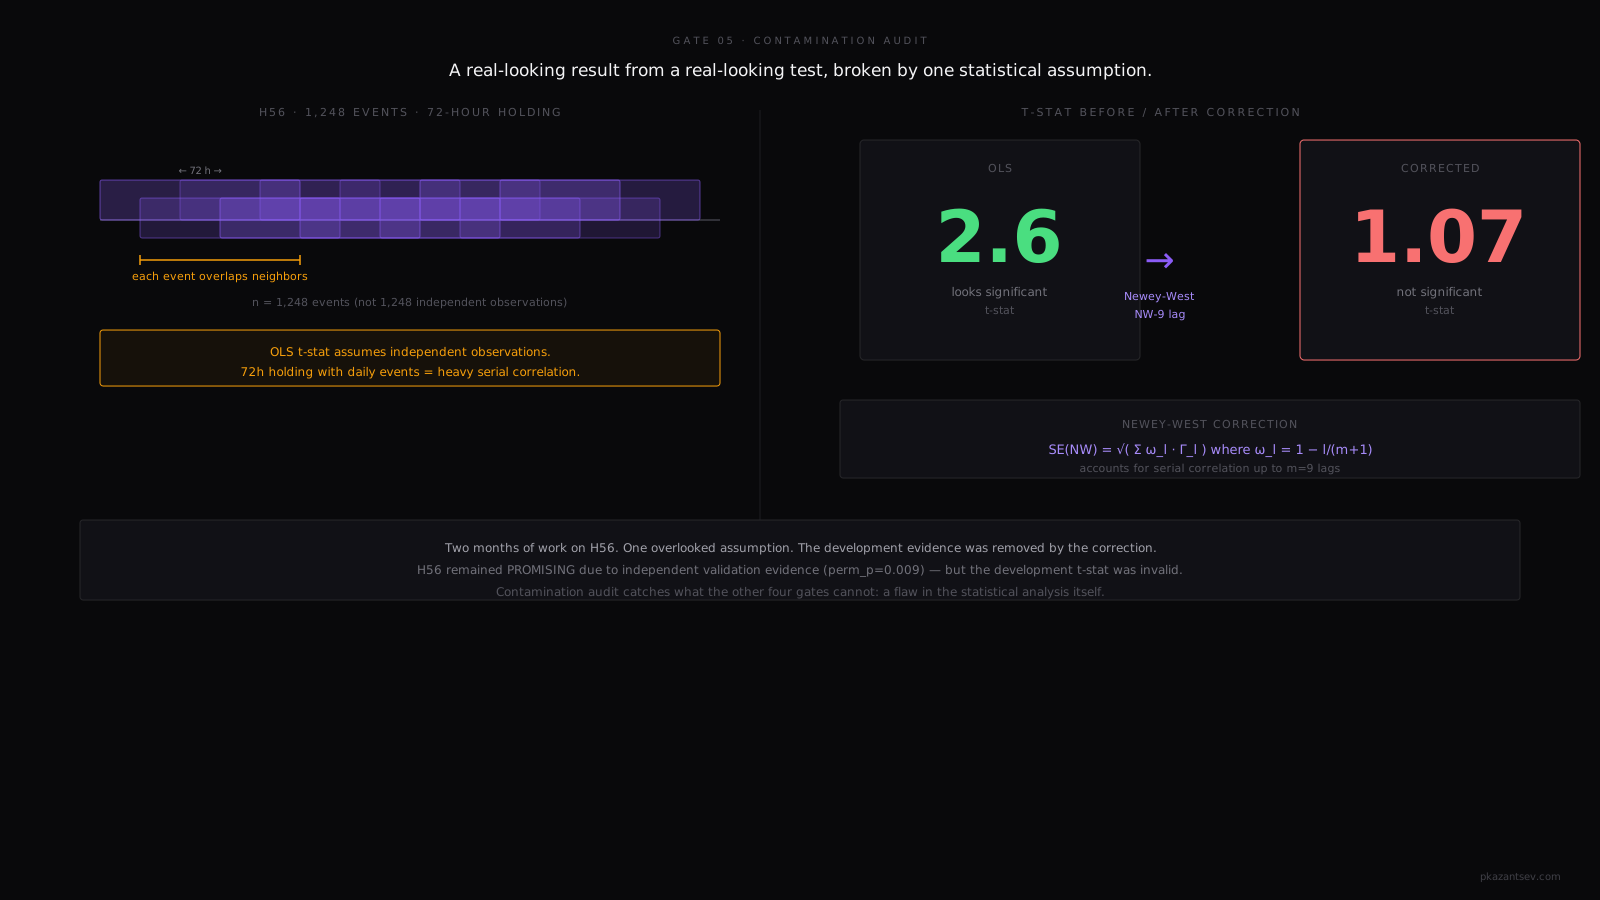
H56 (BTC funding trend signal) had a development t-stat of 2.6. The 1,248 events had 72-hour holding periods, so observations were heavily overlapping. The Newey-West corrected t-stat fell from 2.6 to 1.07, removing the apparent statistical evidence from that test. A real-looking result from a real-looking test, broken by one statistical assumption.
On a separate project, a football prediction model passed closing-line value (CLV) validation with +152 bps, 95% CI excluded zero. A five-check forensic audit found two contaminated features. Four of five checks failed. The metric that reported the good result was the last place to look for the error.
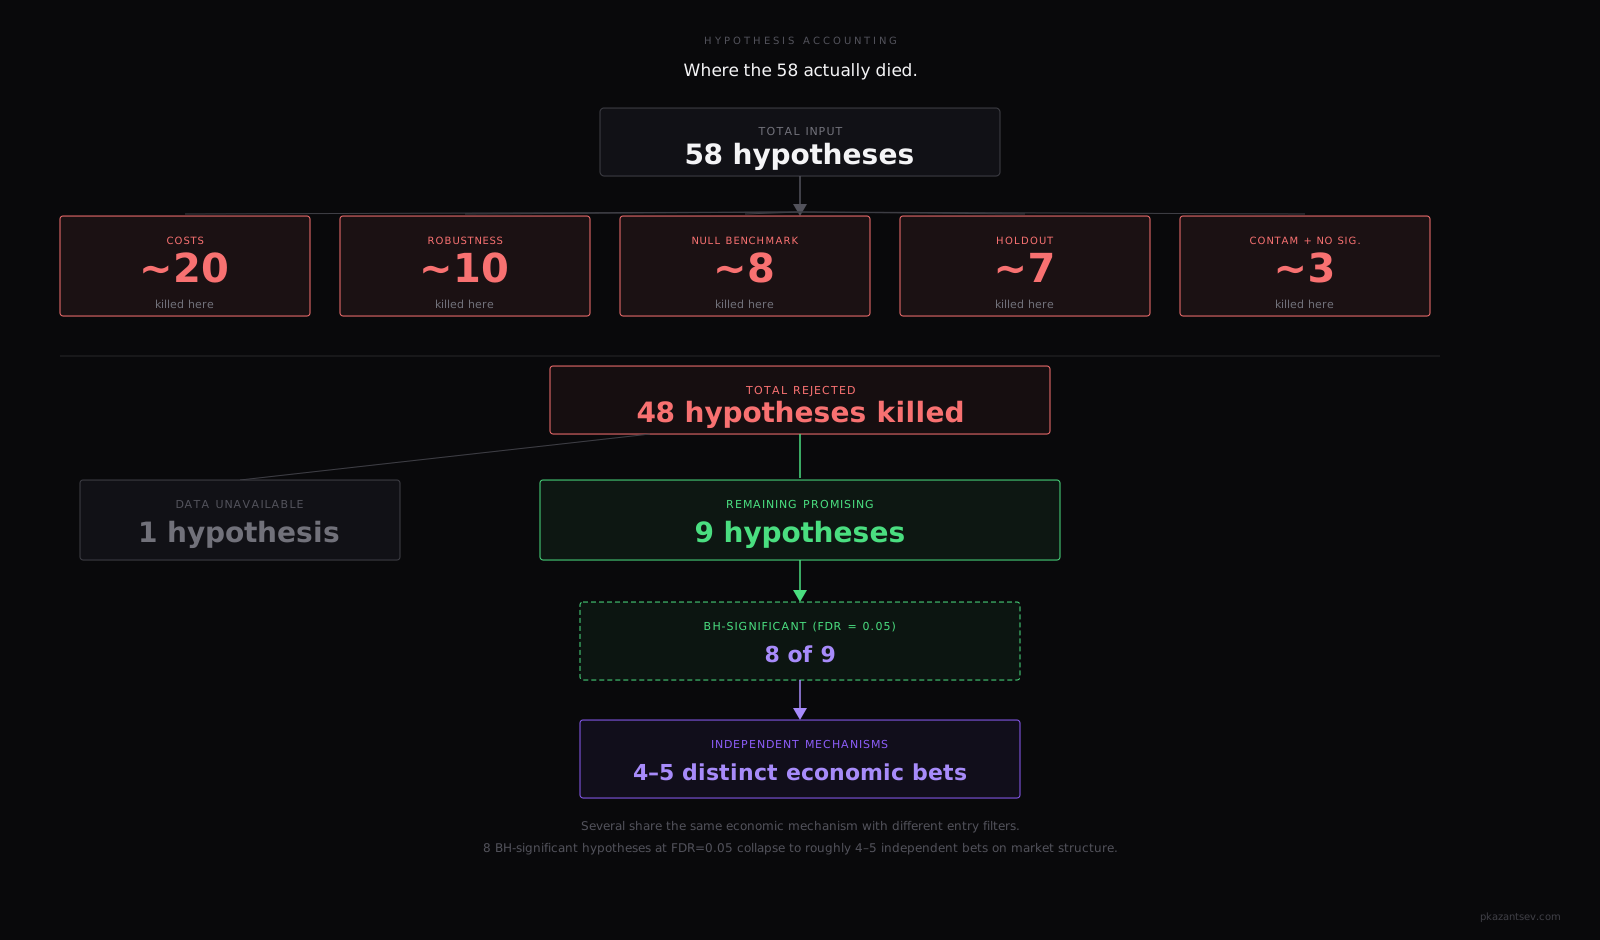
Where the 58 actually died
Each hypothesis is assigned to the first decisive failure that stopped further evaluation. Some failed more than one check.
| Kill gate | Count | Example |
|---|---|---|
| Costs | ~20 | Price MR: gross Sharpe 7–13, net negative |
| Robustness | ~10 | Daily momentum: +97% was one lucky lookback |
| Null benchmark | ~8 | Funding carry null still returned +28% |
| Holdout / fresh OOS | ~7 | Funding carry −0.5% on sealed year; agent ensemble −35% OOS |
| No detectable signal / other rejection | ~3 | New-listing cohort: corr≈0, null p=0.94 |
| Total rejected | 48 | |
| Data unavailable | 1 | Required data unavailable |
| Remaining PROMISING | 9 | Passed development and validation gates |
| Benjamini–Hochberg (BH) significant at FDR=0.05 | 8 | |
| Independent mechanisms | 4–5 | roughly 4–5 distinct economic bets |
9 survivors does not mean 9 strategies. Several share the same economic mechanism with different entry filters. 8 Benjamini–Hochberg (BH) significant hypotheses at FDR=0.05 collapse to roughly 4–5 independent bets on market structure by economic mechanism.
The uncomfortable failures
Two cases that took longer than they should have.
An LLM-generated factor-residual ensemble showed +76% in development, Sharpe 0.6, tuned over multiple iterations. On a fresh holdout it reversed to −35%. The development result held inside the data it was tuned on. The fresh holdout showed what the agent had actually learned: the development period.
In a funding carry reproduction audit a month after the original publication, the holdout result changed from −0.5% to +1.3%. Same code, same data cache, fingerprints matched. I still do not have a clean explanation. I published the discrepancy table rather than quietly resolving it. I scrutinized the original negative result far less than I would have scrutinized a positive one. Negative results get a lower evidentiary standard by default. They should not.
What survived
A handful of hypotheses passed enough gates to justify forward validation. They are currently shadow-deployed: signals recorded in real time, parameters locked, no capital.
None of them earned the right to be trusted based on the backtest. The backtest is permission to collect more data, not permission to trade.
The specific signals are not published here. Forward validation is ongoing and the gate has not been reached.
Steal this framework
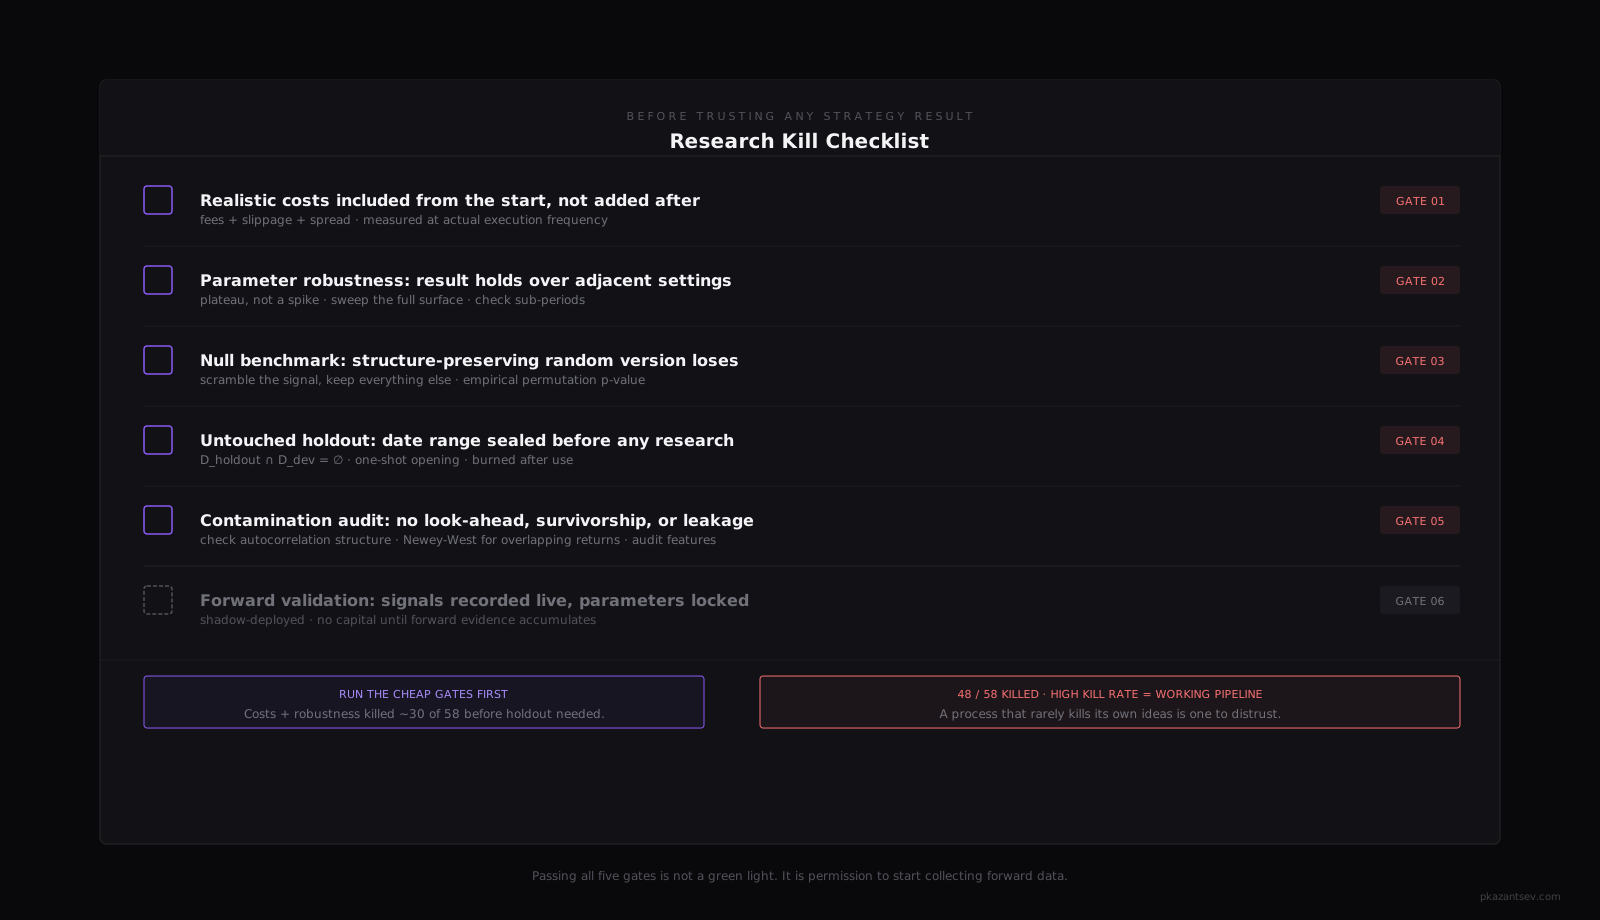
Before trusting any strategy result:
[ ] Realistic costs included from the start, not added after
[ ] Parameter robustness: result holds over adjacent settings (plateau, not spike)
[ ] Null benchmark: structure-preserving random version loses
[ ] Untouched holdout: a date range sealed before any research on that data
[ ] Contamination audit: no look-ahead, no survivorship, no feature leakage
[ ] Forward validation: signals collected in real time, parameters locked
Costs and robustness killed roughly half of the 58 before a holdout was needed. Run the cheap gates first.
One-page version of the framework above. I send new research notes when published.
PK / RESEARCH NOTES
Architecture Review Kit
Rules, annotated diffs, and an audit prompt for catching architecture violations that AI reviewers miss.
The real lesson
A high kill rate is not evidence that the pipeline is good. But a research process that rarely kills its own ideas is one I would distrust.
48 of 58 died. If the kill rate were much lower, I would not trust the process.